
ATHAR Research Canvas
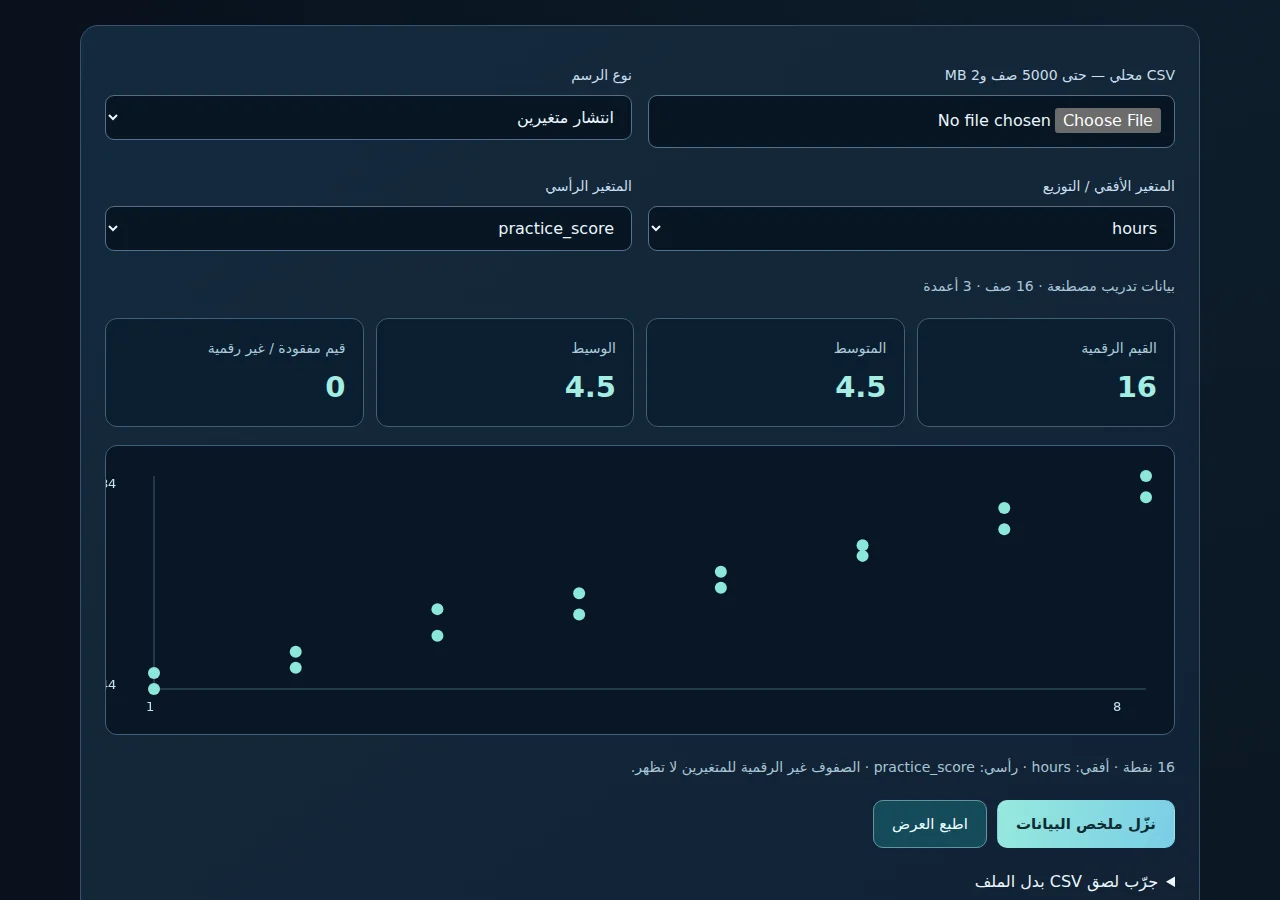
Explore CSV data with descriptive metrics and interactive charts. This does not replace inferential analysis in R.
What You'll Receive
- Preview CSV files and check their structure
- Counts, mean, median and missing values
- Change variables and export a summary
A clear scope.
A dashboard for a de-identified CSV file with up to 5,000 rows and 8 columns, variable selection, descriptive indicators, scatter and distribution plots and summary export. Inferential analysis is requested separately through R services.
Content, timing and revision count are agreed before work begins. Any additions outside the scope are defined with you in advance.